
22.11.2011
19.10.2011
Adobe-Ausstellung: Turning Data into Meaning
Nach einem längeren Intro kann man in der Ausstellung "InForm :: Turning Data into Meaning" im virtuellen Adobe-Museum verschiedene Beispiele für die visuelle Umsetzung von Daten (SMS, Twitter, Wikipedia u.a.). Hier ein Beispiel aus einem Film über den SMS-Versand an einem Jahreswechsel:


08.10.2011
Kartogramme etc.
Symposium Latsis EPFL 2011: MiniMax Mapping Contest.
Die kleinen Videos anschauen!
Rankin: Punktkarten Ethnien in Chicago - Girarding: Touristenwege in Paris und Barcelona aufgrund von Flickr - Beauchesne: Globale Karten mit Verbindungslinien aufgrund wissenschaftlicher Zusammenarbeit - Cruz: Verkehsaufkommen in Lissabon als Adern - Guillemot: Kartogramme der langfristigen Bevölkerungsentwicklung in der Schweiz - Lehmann: Stimmung aufgrund von Twitternachrichten auf Kartogrammbasis (USA).
11.07.2011
Animations of London cycle hire
Watch a map-based transit animations of London cycle hire journeys over the course of 4 October 2010, a day when there was a tube strike. Bikes are represented as tadpoles. Fixed circles represent hire stands, which flash when a bike leaves or arrives.
Der ganze Artikel ("Has London's cycle hire scheme been a capital idea?") diskutiert das neue Velovermietsystem in London.
London Hire Bikes animation from Sociable Physics on Vimeo.
Der ganze Artikel ("Has London's cycle hire scheme been a capital idea?") diskutiert das neue Velovermietsystem in London.
30.06.2011
DataMaps.eu
Von der Idee her mit MAPresso verwandt:
"DataMaps.eu bietet Ihnen ein kostenloses Visualisierungswerkzeug, mit dem Sie ortsbezogene Daten z.B. aus schwer verständlichen Tabellen ohne Programmieraufwand in ansprechende, leicht verständliche Visualisierungen umwandeln können:

Die Stadt München hat im Rahmen ihres MOGDy-Prozesses (»Munich Open Government Day«) Ende Jänner 2011 begonnen, statistische Daten der Verwaltung maschinenlesbar zur Verfügung zu stellen. Darunter sind z.B. Daten zu den Einwohnerzahlen der 25 Stadtbezirke oder wieviele KFZ mit welchem Hubraum pro Stadtbezirk angemeldet sind.Thomas Pfeiffer von Webevangelisten.de hat in diesem Zusammenhang eineApplikation programmiert, welche die einfache Erstellung von Datenlandkarten von München ermöglicht. Den Quellcode dafür hat er dankenswerterweise als OpenSource-Software zum Download zur Verfügung gestellt."
13.06.2011
Kernel Density Estimation
KDE interaktiv und sehr effizient:
Ove Daae Lampe, Helwig Hauser: "Interactive Visualization of Streaming Data with Kernel Density Estimation", Proceedings of the IEEE Pacific Visualization Symposium (PacificVis 2011), 2011
(als PDF und ergänzendes Video)
"In this paper, we discuss the extension and integration of the statistical concept of Kernel Density Estimation (KDE) in a scatterplot-like visualization for dynamic data at interactive rates. We present a line kernel for representing streaming data, we discuss how the concept of KDE can be adapted to enable a continuous representation of the distribution of a dependent variable of a 2D domain. We propose to automatically adapt the kernel bandwith of KDE to the viewport settings, in an interactive visualization environment that allows zooming and panning. We also present a GPU-based realization of KDE that leads to interactive frame rates, even for comparably large datasets. Finally, we demonstrate the usefulness of our approach in the context of three application scenarios -- one studying streaming ship traffic data, another one from the oil and gas domain, where process data from the operation of an oil rig is streaming in to an on-shore operational center, and a third one studying commercial air traffic in the US spanning 1987 to 2008."
Speziell interessant auch die Visualisierung der Schiffsbewegungen (im Video ca. ab 02:12):

12.06.2011

11.06.2011
Eric Fischer: The Geotagger'sWorld Atlas u.a.
Eric Fischer kombiniert die Fotos mit Geotag mit OpenStreetMap. In einem Projekt unterscheidet auch gleich noch die Fotos von Touristen (rot) und Einheimischen (blau) - gelbe können beides sein. Unter den 135 Städten ist auch Zürich:


Census-Daten (Race and ethnicity) zeigt z.B. diese Karte von New York:
09.06.2011
Züriplan
Die "Konkurrenz" schläft nicht: die Stadt Zürich bringt ihren Stadtplan (samt historischer Karten und Fussgänger-/Veloroutenplaner u.v.a.m.) auf iPhone und iPad:


08.06.2011
Eyeo Data Visualization Challenge: Ghost Counties
Jan Willem Tulp wins Eyeo Data Visualization Challenge

The visualization depicts the number of homes and vacant homes for all the counties for each state. The size of the outer bubble represents the total number of homes, the size of the inner bubble represents the number of vacant homes. The y-axis shows the population size (on a logarithmic scale) and the x-axis of the bubbels shows the number of vacant homes per population. Each bubble is also connected with a line to another axis: the population / home ratio. On the top right you can see some exact numbers for this data.
Built with Processing
07.06.2011
OneBayArea: Reisezeiten und Hauspreise
Wohnungs/Haus-Suche abhängig von gewünschter maximal Reisezeit, Verkehrsmittel, Tageszeit und maximalem Hauspreis.
Vielleicht auch für Bürosuche geeignet - allerdings noch nicht für Zürich...


mehr Beispiele auf Stamen blog.
Vielleicht auch für Bürosuche geeignet - allerdings noch nicht für Zürich...
mehr Beispiele auf Stamen blog.
01.06.2011
Mapnificent
Irgend einen Punkt in einer der verfügbaren Städte markieren und sehen, wohin man in der gewünschten Zeit kommt.

Richtig gut wird das ganze, wenn man mehrere Punkte auf die Karte zieht und schaut, wo sich die einzelnen Gebiete überschneiden:
 Beispiel: alle hellen Gebiete sind von beiden Punkten aus in 15 Minuten mit öffentlichen Verkehrsmitteln erreichbar.
mit API-Dokumentation
Mapnificent shows you the area you can reach with public transport from any point in a given time. It is available for major cities in the US and world wide.
Mapnificent was originally inspired by MySociety's Mapumental which is sadly still in private beta.
Mapnificent was created by StefanWehrmeyer.

Richtig gut wird das ganze, wenn man mehrere Punkte auf die Karte zieht und schaut, wo sich die einzelnen Gebiete überschneiden:

mit API-Dokumentation
Mapnificent shows you the area you can reach with public transport from any point in a given time. It is available for major cities in the US and world wide.
Mapnificent was originally inspired by MySociety's Mapumental which is sadly still in private beta.
Mapnificent was created by StefanWehrmeyer.
24.05.2011
maps.google.com auf mobilen Geräten
Auch Google arbeitet an den Kartenangeboten auf mobilen Browsern:
«With 40% of Google Maps usage on mobile devices, we want you to have a consistent Google Maps experience wherever you use it. So, today we’re announcing our updated Google Maps experience for mobile browsers on Android and iOS.
Now, when you visit maps.google.com on your phone or tablet’s browser and opt-in to share your location, you can use many of the same Google Maps features you’re used to from the desktop. This will allow you to:
- See your current location
- Search for what’s nearby with suggest and auto complete
- Have clickable icons of popular businesses and transit stations
- Get driving, transit, biking, and walking directions
- Turn on satellite, transit, traffic, biking, and other layers
- View Place pages with photos, ratings, hours, and more
- When signed into your Google account, access your starred locations and My Maps

mobile.map.geo.admin.ch
swisstopo:
«mobile.map.geo.admin.ch, die BETA Version des Kartenviewer für Mobilgeräte des Geoportal des Bundes ist jetzt online.
Unter dem Begriff «Mobile» wird im Umfeld von geo.admin.ch RE2 eine für Webbrowser von mobilen Endgeräten (Smartphones) Version von geo.admin.ch verstanden. Nach der Durchführung des Codesprints im Februar 2011 steht nun eine BETA Version für den Kartenviewer mit limitiertem Funktionsumanfang zur Verfügung.
Über die BETA mobile.map.geo.admin.ch können über Mobilegeräte mit Android oder iOS (Apple) Betriebssystemen und Standard Webbrowser folgende Funktion genutzt werden:
- Darstellung der Landeskarte unter verschiedenen Massstäben (Zoom-in / Zoom-out),
- Verschieben (Pan) der Karte über Interaktion mit Touchscreen
- Zentrieren der Landeskarten auf die momentane Position (Geolocation) und Anzeigen des Gemeinde, in der sich der Nutzer befindet
- Informationspanel mit
- Feedbackmöglichkeit, um Fehlfunktionen oder Korrekturmeldungen zu übermitteln
- Link zu Vorschau / Wireframe über Funktionsumfang der ersten Vollversion
Diese BETA Version soll erlauben, die wichtigsten Funktionen einem von geo.admin.ch schon zur Verfügung zu stellen und Feedback zu erhalten. Die mobile Version des Portals ist ebenfalls in Bearbeitung und wir sind zuversichtlich, dass RE2 im September 2011 aufgeschaltet werden kann.»

21.05.2011
Dave Bollinger
Dave Bollinger: "I enjoy tinkering with various procedural, generative and algorithmic designs". Faszinierend und extrem vielseitig,

11.05.2011
Buch-Tipp

Und noch ein Buch-Tipp:
Ecological Urbanism, herausgegeben von Lars Müller Publishers
Nicht nur wunderschön (und wie alle bücher wohlriechend) sondern auch noch interessant, vielseiteig und spannend zu lesen.
07.04.2011
And then there was Cartagr.am (bloom blog)
 |
"Technology: Cartagr.am was written using ModestMap.js for the tile mapping and SimpleGeo for the location services and the labels are the Acetate labels from FortiusOne and Stamen."
Leider ist die Doku noch nicht allzu ausgebaut. Es hat aber einige Beispiele:
 |
| Beispiele |
 |
| greatcircle |
 |
| hurricane |
05.04.2011
US-Census-Daten aufgrund von Länge/Breite oder ZIP-Code
Wenn wir noch eine Volkszählung hätten, wäre eine solche API eine Möglichkeit, sie für die Verwendung von Mashups anzubieten (infochimps.com hat übrigens noch eine ganze Reihe weiterer APIs).
Geographic: latitude, longitude, city, area code, zip code, metro code, region code, country code
Ethnic: percent hispanic, percent asian, percent pacific, percent white, percent black, percent native
Age: percent under 5, percent under 18, percent over 65
Population: total, people per household, households, housing units
Demographic: percent female, percent semi permanent, percent bs graduate, percent below poverty, work travel time – in minutes, percent hs graduate, percent non english, percent foreign
Economic: household income – median, per capita income, housing unit value, percent homeownership
Beispiel
Mit dem Input (in diesem Beispiel mit der ZIP-Code)
ergibt sich folgender Ouput:
{"household_income":35757.0,"percent_hispanic":0.15,"percent_semi_permanent":0.27,"percent_asian":0.04,"percent_under_18":0.04,"zip":78701,"percent_bs_graduate":0.14,"per_capita_income":37485,"percent_below_poverty":0.3,"work_travel_time":6.67,"housing_unit_value":212900,"percent_homeownership":0.38,"housing_units":2002,"people_per_household":1.54,"percent_dual_race":0.05,"percent_pacific":0.01,"percent_white":0.73,"population":3780,"percent_hs_graduate":0.14,"percent_non_english":0.26,"percent_foreign":0.12,"percent_black":0.1,"percent_over_65":0.12,"households":1707,"percent_under_5":0.02,"percent_native":0.02,"percent_female":0.37}
Geographic: latitude, longitude, city, area code, zip code, metro code, region code, country code
Ethnic: percent hispanic, percent asian, percent pacific, percent white, percent black, percent native
Age: percent under 5, percent under 18, percent over 65
Population: total, people per household, households, housing units
Demographic: percent female, percent semi permanent, percent bs graduate, percent below poverty, work travel time – in minutes, percent hs graduate, percent non english, percent foreign
Economic: household income – median, per capita income, housing unit value, percent homeownership
Beispiel
Mit dem Input (in diesem Beispiel mit der ZIP-Code)
http://api.infochimps.com/web/an/census/combined?zip=78701&apikey=api_test-W1cipwpcdu9Cbd9pmm8D4Cjc469
ergibt sich folgender Ouput:
{"household_income":35757.0,"percent_hispanic":0.15,"percent_semi_permanent":0.27,"percent_asian":0.04,"percent_under_18":0.04,"zip":78701,"percent_bs_graduate":0.14,"per_capita_income":37485,"percent_below_poverty":0.3,"work_travel_time":6.67,"housing_unit_value":212900,"percent_homeownership":0.38,"housing_units":2002,"people_per_household":1.54,"percent_dual_race":0.05,"percent_pacific":0.01,"percent_white":0.73,"population":3780,"percent_hs_graduate":0.14,"percent_non_english":0.26,"percent_foreign":0.12,"percent_black":0.1,"percent_over_65":0.12,"households":1707,"percent_under_5":0.02,"percent_native":0.02,"percent_female":0.37}
22.03.2011
Ist die Schweiz zu klein, ein Atom-Land zu sein?

17.03.2011
Kartogramme
Eine Vielzahl von Kartogrammen bringt der Blog "Views of the World" von Benjamin D. Hennig (University of Sheffield). Ein aktuelles Beispiel: Die Visualisierung der von Erdbeben bedrohten Personen; Blog: People at Risk: Visualising Global Earthquake Intensity. Hier ein gleich ein Auszug:
The following map shows a more general approach of mapping the risk of earthquakes. It is a visualisation of all major earthquakes that have been complied in the Global Significant Earthquake Database. The database created by NOAA’s National Geophysical Data Center “contains information on destructive earthquakes from 2150 B.C. to the present that meet at least one of the following criteria: Moderate damage (approximately $1 million or more), 10 or more deaths, Magnitude 7.5 or greater, Modified Mercalli Intensity X or greater, or the earthquake generated a tsunami“.
Following an approach of spatial-analyst.net, a kernel density has been calculated from these records to visualise the areas most at risk of earthquakes during that time period. In a last step, I have transformed the world earthquake intensity map (see map inset) using a density equalising cartogram algorithm applied to a population grid. Simply said, the resulting map gives each person living on earth the same amount of space while also preserving the geographical reference. This map allows to understand the earthquake intensity in relation to today’s population distribution, and thus gives an idea of where most people are of risk related to seismic activity:

Paying some tribute to the most recent events in Japan, here is a new population cartogram of the country which is created from a more detailed population grid than the original map from our World Population Atlas. The cartogram shows the shape a very densely populated country and helps to understand, where the majority of Japan’s population is concentrated: “80 million of the urban population is heavily concentrated on the Pacific shore of Honshū. Metropolitan Tokyo-Yokohama, with 35,000,000 people, is the world’s most populous city” (see Wikipedia). The map also includes Japan’s topography (see map inset for a conventional reference map and the surrounding bathymetry, which apparently played a crucial role in the development of the tsunami which followed the earthquake and caused much of the destruction on that densely populated Pacific shore.


14.03.2011
Data-Driven Documents
Mike Bostock's JavaScript library D3.js for manipulating documents based on data.
"D3 allows you to bind arbitrary data to a Document Object Model (DOM), and then apply data-driven transformations to the document. As a trivial example, you can use D3 to generate a basic HTML table from an array of numbers. Or, use the same data to create an interactive SVG bar chart with smooth transitions and interaction.


"D3 allows you to bind arbitrary data to a Document Object Model (DOM), and then apply data-driven transformations to the document. As a trivial example, you can use D3 to generate a basic HTML table from an array of numbers. Or, use the same data to create an interactive SVG bar chart with smooth transitions and interaction.
D3 is not a traditional visualization framework. Rather than provide a monolithic system with all the features anyone may ever need, D3 solves only the crux of the problem: efficient manipulation of documents based on data. This gives D3 extraordinary flexibility, exposing the full capabilities of underlying technologies such as CSS3,HTML5 and SVG. It avoids learning a new intermediate proprietary representation. With minimal overhead, D3 is extremely fast, supporting large datasets and dynamic behaviors for interaction and animation. And, for those common needs, D3’s functional style allows code reuse through a diverse collection of optional modules."
Hier noch ein paar Beispiele
Beim Voronoi-Diagramm ist vor allem beeindruckend, mit welcher Geschwindigkeit die Polygone beim Darüberfahren mit der Maus neu berechnet werden.
Und noch eine spielerische Anwendung (man kann irgendein Bild als Paramter übergeben, http://koalastothemax.com?<your image url>)
09.03.2011
Filme kompakt
Eine wirklich sehr kompakte Darstellung von Filmen (eine Art "Filme aufräumen", bisher 74 Filme, unten z.B. Babel (2006)); erinnert etwas an das Projekt Interactive Information Visualization of a Million Items.
FlowingData: Choice of color in a movie can say a lot about what's going on in a scene. It sets the mood, changes the tone, indicates a change in point of view, so on and so forth, which is why moviebarcode is so fun to click through. The concept is simple. Take every frame in a movie and compress it into a sliver, and put them next to each other. Voilá. Movie barcode."

FlowingData: Choice of color in a movie can say a lot about what's going on in a scene. It sets the mood, changes the tone, indicates a change in point of view, so on and so forth, which is why moviebarcode is so fun to click through. The concept is simple. Take every frame in a movie and compress it into a sliver, and put them next to each other. Voilá. Movie barcode."
07.03.2011
Fractal Lab
Tom Beddard:
MIt Google Chrome auf dem Mac funktioniert die Applikation (Link) problemlos, hier ein Screenshot:

A WebGL based web application for rendering 2D and 3D fractals in real-time.
You will need a WebGL enabled browser, currently Google Chrome or Firefox 4 beta are the best choices, and a reasonably modern graphics card.MIt Google Chrome auf dem Mac funktioniert die Applikation (Link) problemlos, hier ein Screenshot:

04.03.2011
toxiclibs
Karsten Schmidt aka Toxi hat bei den ETH-Architekten einen 50-minütigen Vortrag zu "Code as the primary design tool" im Rahmen des Master of Advanced Studies "Computer Aided Architectural Design 2011" gehalten.
Er zeigt darin viele (meist künstlerische) Beispiele:

Sie beruhen auf der toxiclib-Processing-Library (toxiclibs.org). Die dortigen Beispiele (und die Beispiele im Rahmen des Vortrags) haben mich beeindruckt.

Er zeigt darin viele (meist künstlerische) Beispiele:

Sie beruhen auf der toxiclib-Processing-Library (toxiclibs.org). Die dortigen Beispiele (und die Beispiele im Rahmen des Vortrags) haben mich beeindruckt.
03.03.2011
Map Baidu


Flash vs. Canvas
Ein Vergleich von Canvas/JavaScript und Flash aufgrund verschiedener Kriterien. Die Schlussfolgerung:
Canvas is the future of 2D (and possibly 3D) graphics on the web. Sure, it has a few shortcomings, but as time passes, it will only get better.
You can write it with the same language (JavaScript) as the rest of the interaction logic on your web page. It's fast and getting faster. Once a few competent frameworks appear, it will be just as easy to use as Flash for a huge variety of tasks. And once the iPad ships, Flash will become a liability.
My advice for web developers: if something on your site CAN be done in Canvas, it SHOULD be done in canvas.
(aus: "Bye Bye Flash: Network Graph is now Canvas")

GeoNames WebServices

http://api.geonames.org/findNearby?lat=46.511197&lng=8.94776&fclass=P&fcode=PPLA&fcode=PPL&fcode=PPLC&username=demo&style=full
<geonames>
<geoname>
<toponymName>Aquila</toponymName>
<name>Aquila</name>
<lat>46.5</lat>
<lng>8.95</lng>
<geonameId>2661736</geonameId>
<countryCode>CH</countryCode>
<countryName>Switzerland</countryName>
<fcl>P</fcl>
<fcode>PPL</fcode>
<fclName>city, village,...</fclName>
<fcodeName>populated place</fcodeName>
<population/>
<alternateNames/>
<elevation>0</elevation>
<continentCode>EU</continentCode>
<adminCode1>TI</adminCode1>
<adminName1>Ticino</adminName1>
<adminCode2>2102</adminCode2>
<adminName2>Distretto di Blenio</adminName2>
<adminCode3>5049</adminCode3>
<adminName3>Blenio</adminName3>
<timezone dstOffset="2.0" gmtOffset="1.0">Europe/Zurich</timezone>
<distance>1.25674</distance>
</geoname>
</geonames>
Natural Earth: Free Vector and Raster Map Data
Eine reichhaltige Sammlung von GIS-Daten (administrative Umrisse, Ozeane, Flüsse, Seen, Städte; verschiedene auf dem Relief beruhende Raster) auf globalem Niveau. Hier ein Beispiel für die Länderumrisse (1:10 Mio.):

Natural Earth is a public domain map dataset available at 1:10m, 1:50m, and 1:110 million scales. Featuring tightly integrated vector and raster data, with Natural Earth you can make a variety of visually pleasing, well-crafted maps with cartography or GIS software.
Natural Earth was built through a collaboration of many volunteers and is supported by NACIS(North American Cartographic Information Society), and is free for use in any type of project.
28.02.2011
OpenLayers Examples
Bei den OpenLayers-Beispielen sind auch speziell diejenigen für mobile Devices interessant ("mobile" als Filter eingeben). Mit dem iPhone funktionieren schon einige problemlos, z.B.:


Höhenprofil aus Google-Maps
Tool um direkt mit Google-Maps Höhenprofile erstellen zu können, die dann zusammen mit dem Kartenausschnitt ganz einfach auf der eigenen Webseite integriert werden können.
(Schade sieht man auf der Linie der Karte nicht, wo im Höhenprofil sich die Maus gerade befindet.)
Hier zum Beispiel durch den alten botanischen Garten:
oder die Üetlibergbahn
………………………………………………….
(Schade sieht man auf der Linie der Karte nicht, wo im Höhenprofil sich die Maus gerade befindet.)
Hier zum Beispiel durch den alten botanischen Garten:
oder die Üetlibergbahn
………………………………………………….
25.02.2011
Europe Population Density Map
Da sind dann unsere Zürcher Gipfel kaum mehr auszumachen:

Grössere Version bei flickr, Autor: Savvas Karmaniolas
21.02.2011
Arbeiten und Leben mit der Cloud
Mal was ausserhalb des Themas: Sascha Lobo schreibt über "My Work and Life with the Cloud". Unterhaltsam.
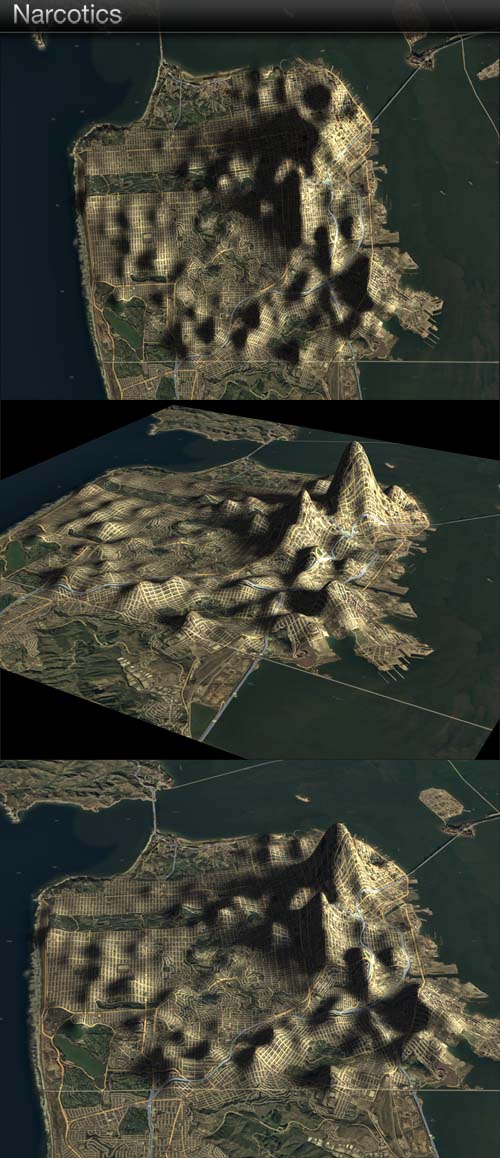
If San Francisco Crime were Elevation
Methodisch nicht ganz so ausgefeilt, wie Adi's Tag-Nacht-Bevölkerungsverteilung...
Die Idee, anstatt der Farben ein Google-Satelliten-Bild zu verwenden gibt aber einen schönen Effekt.
(source: http://dougmccune.com/blog/2010/06/05/if-san-francisco-crime-was-elevation/)
Die Idee, anstatt der Farben ein Google-Satelliten-Bild zu verwenden gibt aber einen schönen Effekt.
(source: http://dougmccune.com/blog/2010/06/05/if-san-francisco-crime-was-elevation/)
17.02.2011
Tag- und Nachtbevölkerung Stadt Zürich
Versuch für eine Illustration im Tages-Anzeiger (mit Structure Synth und Sunflow; Beschreibung des Vorgehens):


Ein Klick auf die Bilder zeigt sie in Originalgrösse (1502 x 3551 Pixel).
16.02.2011
Google Maps API Styled Map Wizard

Mit diesem Tool lassen sich die entsprechenden Map Styles interaktiv festlegen.
Aus der Doku zu den Styled Maps: The
StyledMapType allows you to customize the presentation of the standard Google base maps, changing the visual display of such elements as roads, parks, and built-up areas to reflect a different style than that used in the default map type. These components are known as features and a StyledMapType allows you to select these features and apply visual styles to their display (including hiding them entirely). With these changes, the map can be made to emphasize particular components or complement content within the surrounding page.
15.02.2011
Crime Maps: explore police stats with our interactive tool
UK-Kriminalstatistik beim Guardian.
Last week's launch of the police.uk website clearly proved popular, perhaps excessively so. We teamed up with the engineers behind SpatialKey to build a richer interface on to December's crime data that lets you compare and contrast crime levels by location and type
• How this interactive was made
• Datablog: download the data
• How this interactive was made
• Datablog: download the data

12.02.2011
d3.js
(Ausschnitt aus der Website, ein paar Links gehen (auch dort) nicht):
Data-Driven Documents
D3.js is a small, free JavaScript library for manipulating documents based on data.


D3 allows you to bind arbitrary data to a Document Object Model (DOM), and then apply data-driven transformations to the document. As a trivial example, you can use D3 to generate a basic HTML table from an array of numbers. Or, use the same data to create an interactive SVG bar chart with smooth transitions and interaction.
D3 is not a traditional visualization framework. Rather than provide a monolithic system with all the features anyone may ever need, D3 solves only the crux of the problem: efficient manipulation of documents based on data. This gives D3 extraordinary flexibility, exposing the full capabilities of underlying technologies such asCSS3, HTML5 and SVG. It avoids learning a new intermediate proprietary representation. With minimal overhead, D3 is extremely fast, supporting large datasets and dynamic behaviors for interaction and animation. And, for those common needs, D3’s functional style allows code reuse through a diverse collection of optional modules.
Abonnieren
Kommentare (Atom)